Article Text

Abstract
Background The precision of the population pharmacokinetic model used in therapeutic drug monitoring (TDM) is essential for successful dosage optimisation.
Objective To evaluate the predictive performance of pharmacokinetic models used in our hospital and to evaluate the possible impact of demographic characteristics or renal function on TDM accuracy.
Methods We compared a posteriori an adjusted concentration–time curve profile based on the first measured drug concentration with the second measured drug concentration. Linear regression models were used to compare predicted and observed drug serum concentrations, and to evaluate potential relationships between predictive performance and patients´ demographic/clinical features. Predictive performance of TDM was expressed using accuracy, precision, sensitivity and specificity.
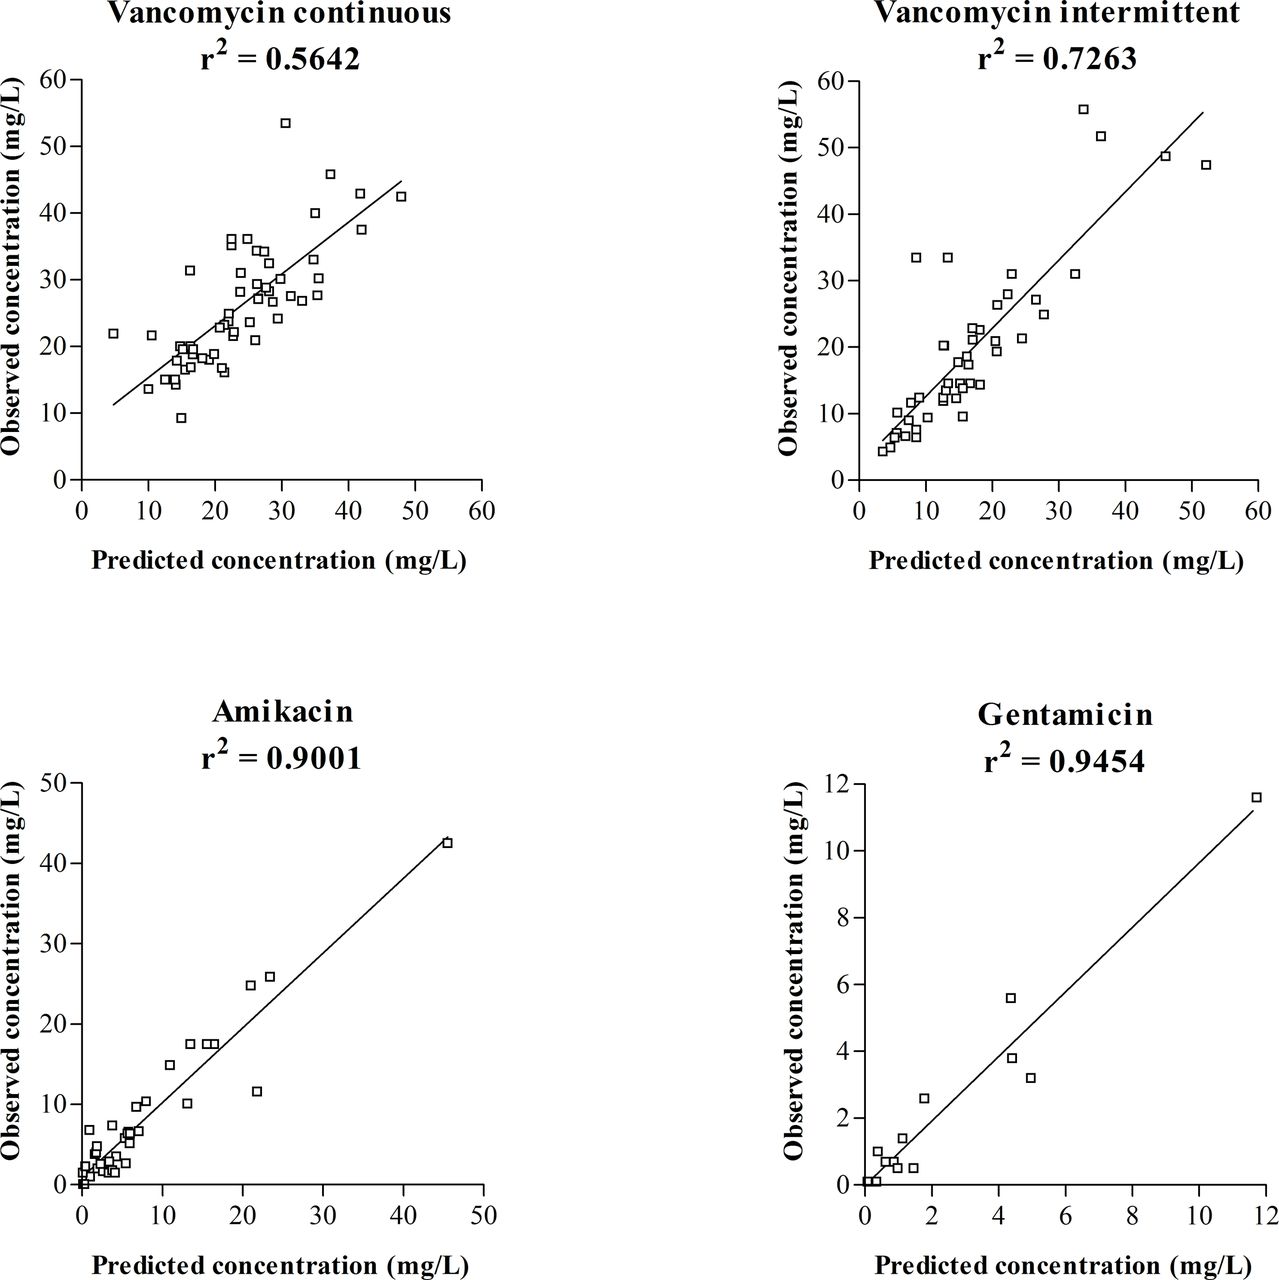
Results One hundred and fifty-two patients were enrolled in the study. All pharmacokinetic models showed good predictive performance expressed by the coefficient of determination (r2) of 0.5642, 0.7263, 0.9001 and 0.9454 for continuous vancomycin, intermittent vancomycin, amikacin and gentamicin, respectively. Accuracy was 93.3%, 91.2%, 113.9% and 130.9% for continuous vancomycin, intermittent vancomycin, amikacin and gentamicin, respectively. Demographic characteristics or renal functions had no substantial impact on the accuracy of TDM.
Conclusion We found the predictive performance of both aminoglycosides and vancomycin pharmacokinetic models to be satisfactory.
- amikacin
- aminoglycosides
- gentamicin
- vancomycin
- pharmacokinetics
- therapeutic drug monitoring
Statistics from Altmetric.com
Introduction
Therapeutic drug monitoring (TDM) aims to optimise individual dosage regimens, enabling the assessment of safety and efficacy of certain drugs. Current TDM approaches include measuring drug serum concentration together with appropriate medical interpretation. Candidate drugs for TDM possess one or more of the following: narrow therapeutic range, high pharmacokinetic (PK) variability and a clear relationship between serum concentration and therapeutic response.1 TDM is also helpful for the drug optimisation in patients with renal, hepatic or gastrointestinal insufficiency.2 Several antimicrobial agents meet the requirements for TDM—aminoglycosides and vancomycin belong among the most frequently monitored drugs.
Aminoglycosides, widely used for treating Gram-negative infections, show concentration-dependent bactericidal activity against sensitive bacteria, while the ratio of the peak concentration to the minimal inhibitory concentration is considered to predict the clinical and bacteriological outcomes of aminoglycosides treatment.3 Aminoglycosides are associated with a potential for nephrotoxicity and ototoxicity, although the risk of toxicity is minimised in a once-daily regimen.4
Vancomycin, with antibiotic activity against Gram-positive bacteria,5 exhibits time-dependent bactericidal activity, while the ratio of the 24-hour area under the concentration–time curve to the minimal inhibitory concentration is considered the most adequate measure to predict the clinical and bacteriological outcomes.6 Limited data suggest a direct causal relationship between specific vancomycin serum concentrations and toxicity, while drug toxicity is rather related to the length of vancomycin treatment and/or co-administration with other nephrotoxic/ototoxic compounds.5
Subtherapeutic levels of aminoglycosides or vancomycin are associated with the emergence of antibiotic resistance and therapeutic failure.7 8
TDM of aminoglycosides and vancomycin is routinely applied in General University Hospital in Prague according to internal TDM guidelines.
Bayesian PK simulation is considered to be the ’gold standard' for TDM. We used MWPharm software (MediWare, Prague, Czech Republic), which is one of the top clinical PK programmes based on a benchmarking survey by Fuchs et al.9 The accuracy of the population PK model used in simulation is essential for successful dosage optimisation.
The main purpose of this study was to evaluate the predictive performance of PK models used at our hospital for TDM. The subsequent aim was to evaluate the accuracy of TDM according to patients´ demographic characteristics or renal functions.
Methods
Study design
A retrospective observational study was performed in adult patients treated with vancomycin or aminoglycosides at the General University Hospital in Prague between January and December 2016. Patients meeting the following criteria were included: age ≥18 years, not receiving dialysis, antibiotic treatment for at least 3 days, and having at least two measured antibiotic serum levels during the course of treatment. Since the study involved only analysis of routine clinical data, patients´ informed consent was unnecessary.
Data collection
Clinical records of evaluated patients were reviewed to collect information about gender, age, height, body weight, serial creatinine and antibiotic serum levels (sampling times included), and antibiotic dosing and administration times.
Creatinine levels were measured using the Jaffe photometric method without deproteinisation on a modular analyser (Roche Diagnostics, Basel, Switzerland), while antibiotic serum concentrations were measured by a turbidimetric inhibition immunoassay (Beckman Coulter, Inc, Brea, California, USA).
For each patient, body mass index, Du Bois body surface area (BSA) and creatinine clearance according to the Chronic Kidney Disease Epidemiology Collaboration (CrClCKD-EPI) were calculated according to standard formulae.10 11
Pharmacokinetic analysis
Individual PK parameters—volume of distribution (Vd), clearance (Cl) and half-life (T1/2)—were calculated using a one-compartmental (for aminoglycosides) or two-compartmental (for vancomycin) PK model based on individual demographic, clinical data and observed drug serum levels using MWPharm software (MediWare, Prague, Czech Republic). The population PK model for antibiotics was individualised to maximise fitting of the simulated PK profile curve with measured drug concentration points in each patient. This fitting was performed initially based on the first measured drug concentration in the course of treatment, and then repeated, when two measured concentrations became available. After fitting using the single drug concentration, drug serum level at the time of the second measured drug concentration sampling was predicted; predicted and observed concentrations were then compared.
Statistical analysis
Descriptive parameters medians, interquartile ranges (IQRs), means and SD were calculated using MS Excel 2010 (Microsoft Corporation, Redmond, Washington, USA).
Potential differences in demographic/clinical characteristics between subgroups (continuous vancomycin, intermittent vancomycin, amikacin and gentamicin) of patients were examined using the Kruskal-Wallis test.
Predictive performance of TDM was expressed using accuracy, precision, sensitivity and specificity. Accuracy was calculated as the percentage error of predicted drug concentration against observed drug concentration. Precision was calculated as the coefficient of variation of the above-mentioned percentage errors. Sensitivity and specificity were calculated according to the following formulae:
sensitivity=true positive ÷ (true positive + false negative),
specificity=true negative ÷ (true negative + false positive),
where true positive means both predicted and observed concentrations were in the therapeutic range; true negative means both predicted and observed concentrations were out of the therapeutic range; false positive means predicted concentration was in, and observed concentration was out of, the therapeutic range; and false negative means predicted concentration was out of, and observed concentration was in, the therapeutic range. We considered a continuous vancomycin concentration of between 15 and 30 mg/L to be within the therapeutic range. The target therapeutic concentrations for intermittent vancomycin dosing were ≤50 mg/L for peak and 10–20 mg/L for trough concentration, for amikacin 35–60 mg/L for peak and ≤4 mg/L for trough, and for gentamicin 15–25 mg/L for peak and ≤1 mg/L for trough.
Linear regression models were used to compare predicted and observed drug serum concentrations, and to evaluate potential relationships between TDM accuracy and patients´ demographic/clinical features (age, height, body weight, body mass index, BSA, serum creatinine and CrClCKD-EPI) using GraphPad Prism 3.02 (GraphPad Software, Inc. La Jolla, California, USA).
Results
One hundred and fifty-two patients were enrolled in the study: 56 patients (37 men, 19 women) were treated with continuous vancomycin, 45 (33 men, 12 women) with intermittent vancomycin, 37 (23 men, 14 women) with amikacin and 14 (five men, nine women) with gentamicin. Demographics and clinical characteristics of the patients are summarised in (table 1). There were no significant differences between subgroups (continuous vancomycin, intermittent vancomycin, amikacin and gentamicin) of patients according to demographic/clinical characteristics.
Demographic and clinical data
The initial doses of antibiotics were administered in accordance with the appropriate Summary of Products Characteristics: 2000 mg/day of vancomycin (with possible reduction according to renal function status), 15 mg/kg of body weight of amikacin in a once-daily regimen and 3–6 mg/kg of body weight of gentamicin in a once-daily regimen. Subsequently, the dosage was adjusted according to TDM.
In total, 188 (2–14 per patient) continuous vancomycin, 157 (2–12 per patient) intermittent vancomycin, 128 (2–10 per patient) amikacin, and 42 (2–5 per patient) gentamicin serum levels were obtained for PK analysis. The median (range) of the second measured serum concentrations was 24.6 (9.3–53.5) mg/L, 17.4 (4.3–55.8) mg/L, 5.2 (0.1–42.5) mg/L and 0.9 (0.1–11.6) mg/L in the continuous vancomycin, intermittent vancomycin, amikacin and gentamicin groups, respectively. The respective values were 23.6 (9.3–53.5) mg/L, 14.6 (4.3–48.7) mg/L, 3.8 (0.1–42.5) mg/L and 0.7 (0.5–3.8) mg/L in men, and 28.3 (14.3–45.8) mg/L, 18.0 (4.9–55.8) mg/L, 5.5 (0.1–25.9) mg/L and 1.0 (0.1–11.6) mg/L in women. Antibiotic PK parameters calculated based on the first two measured drug serum concentrations are summarised in (table 2).
The scatter plot of observed versus measured concentrations of each drug is shown in (figure 1).
TDM predictive performance, expressed as accuracy, precision, sensitivity and specificity, is summarised in (table 3).
Pharmacokinetic data (based on two measured drug serum concentrations)
Statistical measure of predictive performance of therapeutic drug monitoring

Predicted versus observed serum concentrations.
Linear regression models showed no significant relationships between TDM accuracy and patients´ characteristics, except for height (r2=0.0720, p=0.0455) within the continuous vancomycin group.
Discussion
TDM approaches try to optimise dosage regimens by maintaining drug levels within an established therapeutics range. Dosage individualisation consist either of a priori adjustment based on demographic, clinical (and others) covariates, or a posteriori adjustment based on drug concentration measurement.9
It is common to evaluate predictive performance of population PK models by comparing the a priori adjusted concentration–time curve profile with measured drug concentration. Since we typically provide TDM service after measuring the first drug concentration, we compared the a posteriori adjusted concentration–time curve profile based on the first measured drug concentration with the second measured drug concentration as an internal validation of our PK models.
Population PK models were two-compartmental for vancomycin with central compartment volume of 0.21 L/kg of lean body weight, forward fractional rate constant of 1.12 1/h, backward fractional rate constant of 0.48 1/h, metabolic clearance of 0.21 L/h/1.85 m2 and renal clearance of 0.75 × CrClCKD-EPI; one-compartmental for amikacin with Vd of 0.27 L/kg of lean body weight and fractional elimination rate constant of 0.0033 1/h × CrClCKD-EPI (mL/min/1.73 m2); one-compartmental for gentamicin with Vd of 0.21 L/kg of lean body weight and fractional elimination rate constant of 0.0024 1/h × CrClCKD-EPI (mL/min/1.73 m2) + 0.015 1/h.
Except for continuous vancomycin, predicted values of drug levels agreed well with those observed. Since the same population PK model was used for both continuous and intermittent vancomycin assay, the poorer relationship between observed and predicted continuous vancomycin levels probably does not mean a worse predictive performance. This observation may reflect high fluctuations of organ functions in critically ill patients, who are usually treated with continuous vancomycin.12
Linear regression models have indicated that height may affect accuracy in the group receiving continuous vancomycin. We analysed this finding, and concluded that this is probably an artefact. First, height did not affect predictive performance in the group receiving intermittent vancomycin, where the same population PK model was used. Second, if the accuracy of the vancomycin PK model was related to height, then this relationship should also be mirrored for BSA, but we did not observe this relationship. Therefore, we believe that no systematic bias was present in the population PK model used. However, analysis on a larger set of patients will be needed to confirm or refute our deductions, and to prove that this PK model is suitable for continuous vancomycin. No further distortion by patients´ demographic characteristics or renal function status was observed.
Although our study was relatively small (especially in the gentamicin group), we believe, it can be used as a practical tool to evaluate TDM predictive performance. Our study was based on objective PK data derived from the hospital medical records system. Therefore the retrospective nature of our work should not affect the validity of the results.
Conclusion
We have proposed a way to evaluate the predictive performance of population PK models which we use within TDM daily practice. We found the predictive performance of both aminoglycosides and vancomycin PK models to be satisfactory.
What this paper adds?
What is already known on this subject?
Bayesian pharmacokinetic simulation is currently considered as the gold standard for therapeutic drug monitoring (TDM).
The precision of the population pharmacokinetic model used in therapeutic drug monitoring practice is essential for successful dosage optimisation.
What this study adds?
We have proposed a way to evaluate the predictive performance of population pharmacokinetic models used within TDM practice.
We found the predictive performance of pharmacokinetic models used at our hospital to be satisfactory.
References
Footnotes
EAHP Statement 4: Clinical Pharmacy Services.
Contributors All authors meet the BMJ authorship criteria.
Funding The work was supported by Charles University Project Progress Q25 and a grant No. SVV 260373
Competing interests None declared.
Provenance and peer review Not commissioned; externally peer reviewed.