Article Text

Abstract
Objectives To investigate the consumption trend and prescription pattern of opioids in China from 2006 to 2015, and compare the results with those of selected countries and regions, and identify the pain relief level of China.
Methods Nine different opioid drugs were included in our survey, based on the whole population of China. Consumption of each type of opioid was calculated in grams in reports of the Chinese Food and Drug Administration and the International Narcotics Control Board. Then it was converted to the terms of defined daily doses and morphine equivalents. The correlation between consumption of opioids and gross domestic product, human development index and cancer incidence was analysed by Pearson’s correlation test.
Results Defined daily doses increased by 7.89% per year since 2006, and reached 91.05 in 2015. Morphine equivalents increased by 10.57% per year since 2006, and reached 7.24 g in 2015. The average defined daily doses and morphine equivalents were 85.44 and 5.70 g respectively in 2006–2015. Annual defined daily doses of China were lower than the global average. Consumption was related to gross domestic product, but not human development index and cancer incidence. Furthermore, defined daily doses varied greatly in countries with similar gross domestic product or the human development index. Strong opioids or non-intravenous opioids always constituted the majority of opioids, and sustained an increasing tendency in consumption. The predominantly prescribed opioids were fentanyl and morphine. Consumption of oxycodone had a tendency to increase, whereas pethidine tended to decrease.
Conclusion Consumption of opioids has shown an increasing tendency and in the meantime the prescription pattern has changed, indicating the progress of pain relief in China, though it remained far lower than the average global level.
- opioid analgesics;
- drug utilization;
- defined daily dose;
- morphine equivalent;
- pain management;
Statistics from Altmetric.com
Introduction
Opioids are substances that act on opioid receptors to produce morphine-like effects. Opioids are commonly used for the control of clinical pain1 2 and have been identified by WHO as ‘indispensable for the relief of pain and suffering’, so that their availability ‘must be’ ensured.3 4 However, consumption of opioids remains inadequate in some regions of the world, and many patients with moderate and severe pain have no access to the treatment needed.5 It was reported that in 2010, 66% of the world population had virtually no opioid consumption, 10% was very low, 3% low, 4% moderate and only 7.5% adequate.6 This discrepancy differs considerably among different countries and regions. The consumption was high in some European countries such as the UK, and in the USA and Canada.7 However, it was very low in some Asian countries such as India, Thailand and China.7 It has been reported that the average morphine equivalent (MEs) of China was 2.86 mg per capita, while the average level of the top 20 countries in the human development index (HDI) was 216.7 mg per capita in 2010.6
The Chinese government and health organisations have made great efforts to address this situation. The Chinese government has issued ‘the regulations on the administration of anaesthetic drugs and psychotropic drugs’ in 2005,8 which regulates the administration of opioids, ensures their legitimate medical utilisation, and prevents illegal abuse. The National Health and Family Planning Commission (NHFPC) of the People’s Republic of China has launched the ‘Good Pain Management Programme (GPM programme)’ across the country since 2011.9 10 The GPM programme emphasised the control of cancer pain and reasonable application of opioids. The NHFPC has also sponsored the training of professionals, publishing guidelines for pain management, distributing patient educational materials, and organising seminars or workshops throughout the country.11 As a result, some changes have recently been made in the consumption and prescription pattern of opioids. Hence the aim of this study is to investigate the consumption trend and prescription pattern of opioids in China from 2006 to 2015, compare the results with those of selected regions and countries, and identify the pain relief level of China.
Methods
Data sources
Eleven kinds of opioids are used on the Chinese mainland: morphine, fentanyl, oxycodone, codeine, opium, hydromorphone, hydrocodone, pethidine, dihydrocodeine, methadone and buprenorphine. Dextropropoxyphene, ketobemidone, tilidine and trimeperidine were not accessible in China. In our study, methadone and buprenorphine were excluded because their use for pain relief cannot be distinguished from their predominant treatment for dependence on illicit opioids. Therefore, consumption of morphine, fentanyl, oxycodone, codeine, opium, hydromorphone, hydrocodone, pethidine and dihydrocodeine was included and analysed in our study.
This study was based on the whole population of China. The Chinese Food and Drug Administration (FDA) and the International Narcotics Control Board (INCB)12 annually report the consumption of each type of opioid. They reported the consumption of opioids in grams. We estimate consumption in terms of defined daily doses (DDDs) and MEs.
The data for cancer incidence were reported by Chen et al.13 14 Population, gross domestic product (GDP) and HDI data were retrieved from the World Bank15 and the Human Development Report.16
Statistical analysis
The DDD is a statistical unit defined by the WHO Collaborating Centre (WHOCC) for Drug Statistics Methodology.17 In our study, DDDs were shown as the values per million people per day and calculated with the following formula:
DDDs = (∑(Total dose used)/DDD)/365/population
ME is another unit to measure the consumption recommended by IAHPC.18 19 ME ratios are recommended by WHOCC for Drug Statistics Methodology.20 In our study, MEs are shown as the values per million people per day and calculated with the following formula:
MEs = (∑(Total dose used)*(ME ratio))//365/population
GDP was shown as GDP per million people per day and calculated with the following formula:
GDP = (total GDP)/365/population
Correlation of consumption of opioids and GDP, HDI and cancer incidence was analysed by applying Pearson’s correlation test in SPSS version 21 (IBM Corporation, Armonk, New York, USA). P<0.05 was considered a linear correlation.
Results
Opioid consumption had an increasing tendency
DDDs have increased by 7.89% per year since 2006 and reached 91.05 in 2015. The DDD in 2015 was 1.98 times that in 2006 (figure 1A). MEs increased by 10.57% per year since 2006 and reached 7.24 g in 2015. The ME for 2015 was 2.47 times that in 2006 (figure 1B). The average DDD and ME were respectively 85.44 and 5.70 g in 2006–2015.

The consumption of opioid analgesics in China from 2006 to 2015. (A) The defined daily doses (DDDs) of opioid analgesics. (B) The morphine equivalents (MEs) of opioid analgesics.
Consumption of China is relatively low in the world
We further compared opioid consumption in China with the average value for some other main regions of the world. In 2011–2013, the annual average DDD for China was 96, which was much lower than the global average value. Around the world, the DDD for China was much lower than the average level of North America, West and Central Europe, Oceania, Southeast Europe and South America, similar to the average level of East Europe and Central America, but higher than the average level for Africa and South Asia (table 1).
The average defined daily doses (DDDs) of opioids in each main region in 2011–2013
As an important country in East and Southeast Asia, the DDD for China was lower than the mean value of this region. It ranked sixth place among the 16 countries in this region. It was much lower than that of South Korea, Japan, Singapore, Brunei and Malaysia, but higher than other countries (table 2).
The average defined daily doses (DDDs) of countries in East and Southeast Asia in 2011–20137
Influence factors in the consumption of opioids
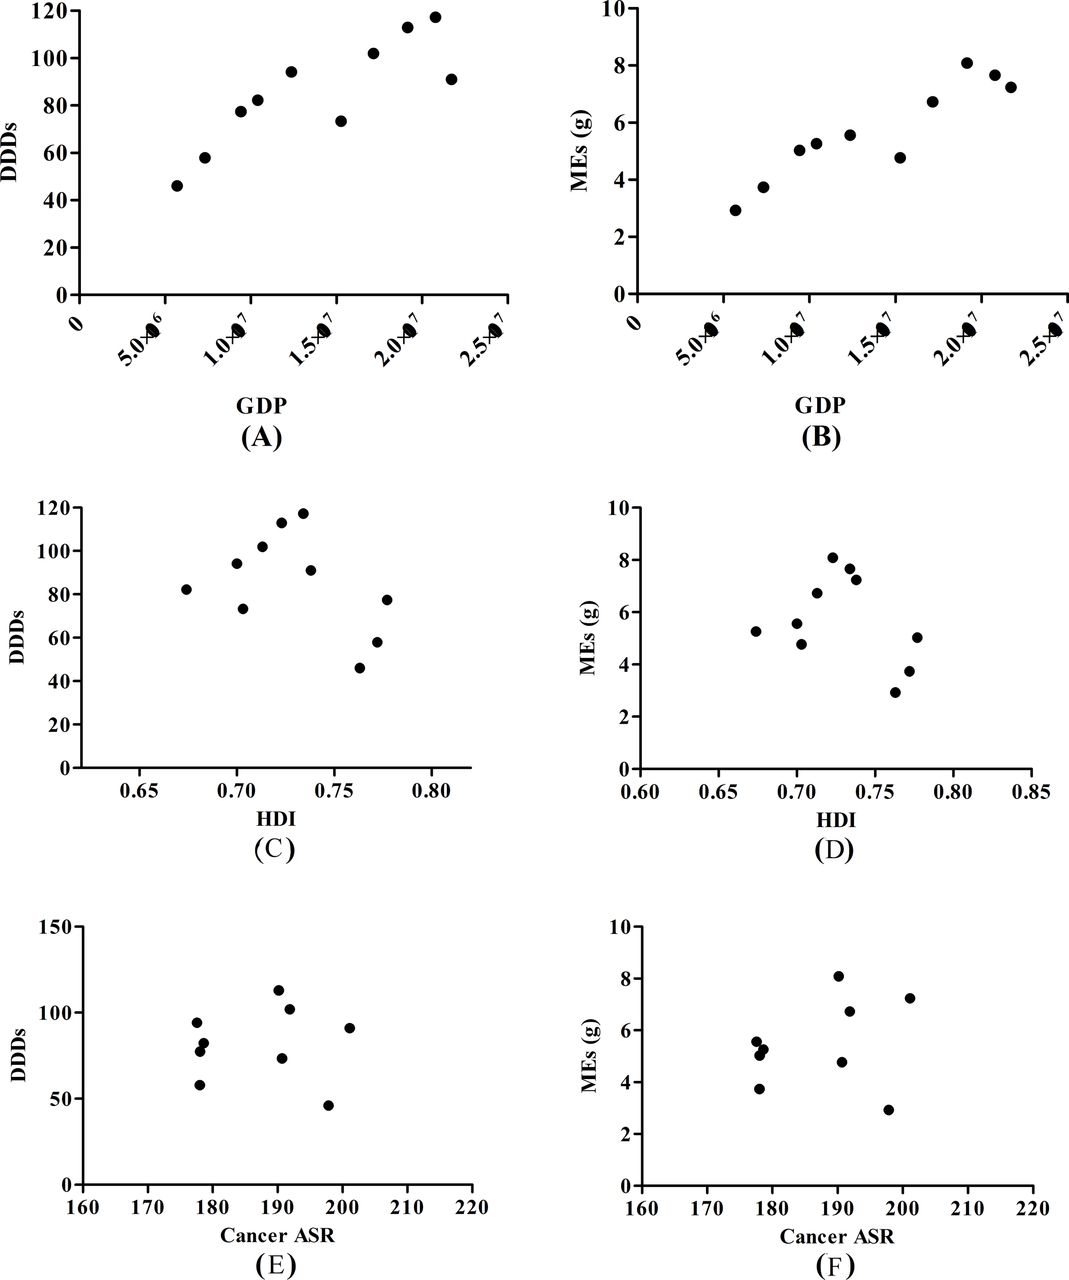
GDP had a positive linear correlation with DDDs (R2=0.84, P<0.0025) (figure 2A) and MEs (R2=0.92, P<0.0002) (figure 2B) in 2006–2015. However, the DDDs of opioids varied greatly in countries with similar GDP (13–21 million dollars).15 The DDD for China was much lower than that of the Arab World, St Vincent and the Grenadines, Belarus, Serbia and Montenegro, almost the same level as Thailand, Macedonia, Cuba, Peru and Botswana, but higher than that of St Lucia, Iraq, Angola, Azerbaijan, Turkmenistan, the Maldives and Dominican Republic (online supplementary table S1).
Supplementary file 1

Analysis of influence factors of opioid consumption in China from 2006 to 2015. (A) Correlation analysis of defined daily doses (DDDs) and gross domestic product (GDP); (B) correlation analysis of morphine equivalents (MEs) and GDP; (C) correlation analysis of DDDs and human development index (HDI); (D) correlation analysis of MEs and HDI; (E) correlation analysis of DDDs and cancer age standardised rate (ASR); (F) correlation analysis of MEs and cancer ASR.
The calculation formula for HDI has changed since 2009,16 and the correlation between HDI and opioid consumption could not be measured (figure 2C,D). In countries of similar HDI (0.68–0.75),16 the consumption of opioids varied greatly. The consumption in China was much lower than that of Jordan, Colombia, Brazil, Bosnia and Herzegovina, almost the same level as Ecuador, Thailand, the former Yugoslav Republic of Macedonia and Peru, but higher than that of Suriname, Saint Lucia, Azerbaijan and Dominican Republic (online supplementary table S2).
Opioids are extensively used for the control of cancer pain. Age-standardised cancer incidence (ASR) changed little,13 14 while the consumption of opioids showed upward trends during the study period. Cancer ASR had no correlation with DDDs (R2=0.03, P=0.9464) (figure 2E) and MEs (R2=0.24, P=0.53) (figure 2F).
Prescription pattern of opioids
Strong opioids accounted for more than 90% of the total consumption and had a tendency to increase. The DDDs of strong opioids in 2015 was twofold that in 2006. The DDDs of weak opioids remained low and changed little in 2006–2015 (figure 3A).
Consumption of non-intravenous opioids always constituted the majority of total consumption from 2006 to 2015. The DDDs of non-intravenous opioids had a tendency to increase. The DDDs of non-intravenous opioids in 2015 was 2.54 times that in 2006. The DDDs of intravenous opioids changed little in 2006–2015 (figure 3B).

Consumption of opioid subtypes in China from 2006 to 2015. (A) Consumption of strong and weak opioids; (B)consumption of intravenous (IV) and non-IV opioid analgesics. DDD, defined daily dose.
Some changes have happened in the prescription pattern of opioids from 2006 to 2015. Consumption of fentanyl, which was the highest in 2006–2014, decreased to be lower than morphine and oxycodone in 2015. The DDD of morphine, which accounted for more than 20% of the total consumption, had a general tendency to rise in 2006–2015. Consumption of oxycodone was low in 2003–2011, but increased markedly in 2012–2015. The proportion of DDD of oxycodone constituted up to 27.70% of the total DDD in 2015. Consumption of pethidine reduced since 2010 and was used by a minority in 2015. Consumption of other opioids such as codeine, opium, hydromorphone and hydrocodone remained low in 2006–2015 (figure 4).

Consumption of each type of opioid in China from 2006 to 2015. DDD, defined daily dose.
Discussion
For decades, morphine consumption has been proposed by WHO as an indicator of cancer pain management.21 The production and consumption of morphine have significantly increased in China from 1992 to 2011.8 However, over the past 20 years, additional opioids, such as fentanyl, hydromorphone and oxycodone, have been introduced in global and national markets. These types should be considered when studying the consumption of opioids.20 In our study, we included morphine, fentanyl, oxycodone, pethidine and hydromorphone as in previously reported studies, but we also included codeine, opium, hydrocodone and dihydrocodeine, which are still used in China. As shown in our study, the consumption of opioids had a general tendency to increase from 2006 to 2015 (figure 1), which reflected the progress in pain relief in China.
However, the opioid consumption of China was relatively low compared with the rest of the world. The DDDs of China was much lower than the average level of the whole world and most other regions (table 1), indicating that the pain relief level of China was relatively low compared with the rest of the world. Within East and Southeast Asia, the consumption of China was lower than the mean value of this region, and ranked sixth place of the 16 countries in this region (table 2), which indicates a medium level of pain relief in China. The study of Berterame et al also demonstrated the relatively low level of pain management in China.7
Many impediments could influence the consumption of opioids. The study by Berterame et al showed that GDP and HDI are important determinants of the consumption of opioids.7 In our study, consumption was correlated with GDP (figure 2A and B), but not with HDI. Furthermore, DDDs varied significantly in the countries with similar GDP (online supplementary table S1) or HDI (online supplementary table S2), meaning that these were not decisive measures of consumption.
The prevalence of health disorders warrants the use of certain drugs.7 Opioids are extensively used for the control of cancer pain.21 However, no correlation has been found (figure 2E and F). Berterame et al examined the relationship between cancer incidence and opioid consumption in countries worldwide and regionally, and found the relation shows a marked variation, as would be expected in view of the disparities in use between countries.7 So we considered that the increasing consumption of opioids in China might be caused by other factors.
Other impediments identified include reimbursement policies, prescription regulations and availability of pain services.11 21 22 Reimbursement policies of opioids had improved in 2009. Sustained-release formulations of opioids, such as controlled-release morphine, controlled-release oxycodone and transdermal fentanyl, have been involved in healthcare since 2009.23 This change in reimbursement policies might help in the availability of opioids.
The Chinese government has issued ‘the regulation on the administration of anaesthetic drugs and psychotropic drugs’ since 2005.8 The regulation has been used in the administration of opioids to ensure their legitimate medical utilisation and to prevent illegal abuse. According to this regulation, the prescription dose for injection, other types of formulations and sustained-release formulations has been extended to a 3-day dose, a 7-day dose and a 15-day dose for cancer-related pain.8 This might have contributed to the increasing consumption of opioids.
Expansion of pain services may be a potential contributor to this increase. The NHFPC of the People’s Republic of China has launched the ‘GPM programme’ across the country since 2011.9 A total of 87 hospitals have enrolled in this programme since 2012.10 The GPM programme emphasised the control of cancer pain and reasonable application of opioids. Yang et al 24 revealed that the GPM programme could improve the pain management of patients with cancer and provide experience for improving cancer pain management in the future.
The GPM programme highlights the non-invasive administration of opioids, which was also emphasised by WHO’s cancer pain ladder for adults.25 Therefore, consumption of non-iv opioids always took majority of the total consumption, and had an ascending tendency in 2006–2015 (figure 3B).
Since 1986, the WHO three-step ‘ladder’ has recommended weak opioids for patients with moderate pain.26 Recent researches have revealed that passing directly from step I to step III of the WHO analgesic ladder is more efficient than the traditional three-step strategy for mild–moderate chronic cancer pain.25 26 Nowadays, the European Association for Palliative Care (EAPC) guidelines recommend small dose of strong opioids instead of weak opioids for patients with refractory moderate pain.27 The NCCN adult cancer pain guideline recommends opioids for all levels of pain.28 This could explain the overwhelming usage of strong opioids in 2006–2015 (figure 3A).
The prescription pattern of opioids for pain management has changed. For decades, morphine has made a large contribution to total opioid consumption in most countries.21 In our study, the DDD of morphine was lower than that of fentanyl in 2006–2014. Fentanyl was the most widely applied type in 2006–2014 (figure 4). Increased use of fentanyl has been reported in many countries such as the USA, Japan, Austrilia, Norway, Spain and Sweden.29 Transdermal fentanyl enables a slow increase of drug plasma level with a very long apparent half-life, and has fewer opioid-related gastrointestinal side effects, such as nausea, vomiting and constipation.30 In addition, the DDD for fentanyl used in this study was 0.6 mg, which was recommended by WHO and INCB, but the daily dose is usually 1.2–2.4 mg/day in our practice. This might explain the large consumption of fentanyl in China.
Increased use of oxycodone has also been reported in many countries.29 The rescue analgesic dose of controlled-release oxycodone is smaller than that of controlled-release morphine, while the occurrence rate of constipation, nausea and vomiting is lower than that of controlled-release morphine.31 In our study, the consumption of oxycodone increased significantly in 2012–2015, and constituted 27.70% of the total consumption in 2015 (Fig 7). Pethidine has a short duration of action and is limited to patients allergic to or unable to tolerate all other opioids in many countries including China. Routine and long-term use of pethidine is not recommended by health experts, who are concerned about its efficacy, toxicity and potential for abuse.19 A decrease in consumption of pethidine has been observed in many other countries such as Australia, Denmark and the USA. In our study, pethidine was one of the main types in 2006–2009, had a general tendency to decrease since 2010, and became a minority type in 2015. Consumption of other opioids such as codeine, opium, hydromorphone dihydrocodeine and hydrocodone were always low from 2006 to 2015 (figure 4). Briefly, the prescription pattern of opioids was generally reasonable.
Conclusion
The consumption of opioids had an increasing tendency and the prescription pattern has changed, indicating the progress in pain relief in China from 2006 to 2015, though it remained far lower than the average global level. The Chinese government has taken steps to emphasise the control of pain and expansion of pain services, but more needs to be done in the future.
What this paper adds
What is already known on this subject
The consumption of opioids was very low in China in 2010.
The Chinese government and health organisations have made great efforts to address this situation.
What this study adds
The consumption of opioids had an increasing tendency in China from 2006 to 2015, though it remained far lower than the average global level.
The prescription pattern of opioids has changed in China from 2006 to 2015.
The Chinese government has taken steps to emphasise the control of pain and expansion of pain services, but more needs to be done in the future.
Acknowledgments
The work was supported by the Shire Biological Medicine Fund of Jiangsu Pharmaceutical Society (S201602).
References
Footnotes
EAHP Statement 1: Introductory Statements and Governance.
Contributors WF: data calculation; data analysis; article design and writing. TL: manuscript revising. ZG: data check; statistical analysis. QL: data check; statistical analysis. CL: statistical analysis check.
Funding This study was funded by Shire Biological Medicine Fund of of Jiangsu Pharmaceutical Society.
Competing interests None declared.
Patient consent Obtained.
Provenance and peer review Not commissioned; externally peer reviewed.