Article Text

Abstract
Objectives The 2017 EAHP European Statements Survey focussed on sections 2, 5 and 6 of the European Statements of Hospital Pharmacy. Statistical data on the level of implementation and on the main barriers to implementation of the Statements were collected. A further aim was to identify barriers in general, such as lack of awareness.
Methods An online questionnaire was sent to all hospital pharmacies in European Association of Hospital Pharmacists (EAHP) member countries. Data were analysed at Keele University School of Pharmacy, UK by and the EAHP Survey Group.
Results There were 783 complete responses (response rate 17.4%). Some 42% of responders worked in teaching hospitals, 76% of hospital pharmacies had 10 or less pharmacists, and 46% of hospital pharmacies served over 500 beds.
Five questions revealing the lowest implementation levels were further analysed in greater detail. Only 30% of respondents reported that their hospital pharmacists routinely publish hospital pharmacy practice research, and only 50% are involved in the development of local or national guidelines. 45% of respondents reported that computerised decision support was used to reduce the risk of medication errors in their hospitals, 69% stated that they had contingency plans for medicines shortages and 60% answered that they had had reason to contact their medicines authority because of drug shortages. 63% reported that the transcription step had been eliminated from the medicines administration process.
Conclusions The survey has provided the EAHP with an overview of the implementation level as well as the barriers to and drivers of implementation of sections 2, 5 and 6. This is important for informing the plans of EAHP and its members so that implementation can be fully supported.
- survey
- European statements of hospital pharmacy
- hospital pharmacy education
- hospital pharmacy
- medication safety
- drug procurement
Statistics from Altmetric.com
- survey
- European statements of hospital pharmacy
- hospital pharmacy education
- hospital pharmacy
- medication safety
- drug procurement
Key messages
What is already known on this subject
The 2014/2015 European Association of Hospital Pharmacists (EAHP) baseline survey and the 2015 Statements Survey provided general knowledge of the baseline level of implementation of the Statements in sections 2, 5 and 6.
What this study adds
This paper updates our knowledge of the level of implementation of sections 2, 5 and 6 of the Statements as well as identifying the main barriers to and drivers of implementation. The biggest implementation challenges in hospital pharmacies are:
Publication of research activities
Creating contingency plans for medicines shortages and a high occurrence of shortages
Implementing and using computer supported decision tools
Involvement in developing local and national guidelines and policies
Removing transcription from the medicines administration process.
The most important barriers to implementation are insufficient capacity and differing priorities between hospital and health system managers.
Introduction
Since 2015, the European Association of Hospital Pharmacists (EAHP) survey has been focused on measuring implementation of the European Statements of Hospital Pharmacy (‘Statements’)1 across 35 European countries. This new survey model, developed and approved by delegates at the EAHP General Assembly in 2014, modernised the survey by using an online tool to optimise data collection while minimising workload for survey respondents. This tool was intended to support EAHP efforts in implementing the summit outcomes (the Statements and other major EAHP projects). The EAHP Survey Group established a model with a ’baseline survey' and two ’statements surveys' rotating in 2-year cycles, each year covering three of six sections of the Statements.2 This article provides an overview of the most important results of the latest survey that covered sections 2, 5 and 6 of the Statements and compares these data with the results of the 2015 survey, which focused on the same sections, and the baseline survey in some cases.3 4
Methods
The survey was drafted using the same questions as the 2015 survey and then conducted from October 2017 to November 2017, spanning 34 of the 35 EAHP member countries.
As with previous surveys, the 2017 EAHP Statements Survey consisted of three sections:
Section A: general questions about the participant’s hospital pharmacy, such as workforce skill-mix and number of beds served
Section B: questions about the current activity of pharmacists around each Statement from sections 2, 5 and 6
Section C: questions about the hospital’s readiness and ability to implement the Statements.
The questions in section B of the survey were to identify if participants thought that the Statements of Hospital Pharmacy were already being implemented in their hospital. To achieve this aim, the pharmacists who participated in the survey were asked to rate the degree to which they were able to comply with each statement. A value was allocated to each response using a scale of 1–5, where 1 indicated that they were never able to comply with the statement, while 5 indicated that they always complied with the statement. For some questions in the survey, a Yes/No option was used, as this was deemed more appropriate than a scale of 1–5 in these cases.
For the purposes of identifying those Statements where the barriers to implementation were greatest, a response of 3, 4 or 5 was considered to indicate less difficulty in complying with that statement and was deemed a ‘positive response’. If the response was 1 or 2, the participant was asked a follow-up question to identify the barriers to implementing the statement.
In order to improve the efficiency of result analysis and provide greater insight into the key drivers and barriers to implementation of the tatements, the respondent was given a range of pre-selected options to choose from. These options were based on the most frequent answers given in the baseline survey. Five standard pre-selected options were used for every question, although some questions had additional specific options. There was also an ’Other' option, where the respondent could provide a free-text response if they had extra information to impart. The five main options were:
We are prevented by national policy and/or legislation
Not considered to be a priority by my managers
Not considered to be a priority by me
We would like to do this, but we have limited capacity
We would like to do this, but we have limited capability.
The survey was created using the online survey software SurveyMonkey and was conducted in English. It was distributed to hospital pharmacies using a SurveyMonkey email collector (one link per one hospital pharmacy) using the contact lists provided by EAHP Survey coordinators.
A few countries did not wish to share the emails of their country’s chief pharmacists. In those cases, a weblink version of the survey was created whereby a single link was given to a coordinator to distribute to the hospital pharmacists in their country. The weblink version of the survey began by asking for a unique code to identify the respondent. This method was much more time consuming to implement as the tracking of respondents was done manually.
Significance testing was performed to compare the results of some of the survey questions to the same question asked in surveys in previous years. The survey questions from section B were identical for the 2017 and 2015 surveys but slightly different from the baseline survey which did not contain as many questions, so not every survey question had three points of data. Testing was performed to compare the 2017 survey data with the baseline data, or the 2015 survey data in the event of there being no baseline data for a given question. To limit the effect of outliers on the result, countries with less than five responses were excluded from testing. Testing was performed using IBM SPSS software, and Shapiro-Wilk’s test was performed first to check for normality. In most cases the differences between the distributions of data were considered to be approximately normal, so paired t-tests were performed to test for significance between 2 years of survey data. For the few cases where a parametric test was not appropriate, the Wilcoxon signed-rank test was used instead.
Some testing was also done to compare the results of statement survey questions to staffing levels (ie, the results of question G4, ‘How many fully qualified pharmacists are employed by your hospital?’). For Likert scale survey questions, a Kruskal-Wallis test was performed after checking for normality, and for the categorical (Yes/No) survey questions Pearson’s χ2 test was used.5
Results
A total of 979 pharmacies responded to the 2017 EAHP Statements Survey, with 783 of these fully completing the survey. As done in previous years, if an incomplete survey was submitted, the quantitative data were not used in the results but the qualitative data were still included.
The overall response rate to the 2017 survey was 17%, with wide variations across different countries. Nineteen of the 34 countries had a response rate of over 30%. More hospital pharmacies completed this survey than any of the previous surveys.
The response rates for the 2017 EAHP Statements Survey are listed in online supplementary table 1, broken down by country. The response rates from the 2015 baseline survey are given in the final column for comparison.
Supplemental material
Section A
The results showed that 42% (332, n=783) of responders worked in teaching hospitals. These numbers are similar to those in the baseline survey (42%) and the 2015 survey (43%). Some 72% of respondents were from general hospitals (566, n=783). This number is again very similar to those seen in previous surveys (71% in both the baseline and 2015 surveys). The results of the ’Other hospitals' category indicated that 43 responses were from psychiatric hospitals, nine from paediatric hospitals, seven from traumatology hospitals, 18 from oncology hospitals, and nine from geriatric hospitals. Approximately 46% of hospital pharmacies served hospitals with 100–500 beds (359; 45% in 2015 and 50% in the baseline survey), 24% served hospitals with 500–1000 beds, 21% served hospitals with >1000 beds, and 9% served hospitals with <100 beds. The majority of the hospital pharmacies (598, 76%) only employed 1–10 fully qualified pharmacists at the time of the survey and a similar number of pharmacy technicians (563 pharmacies, 72%). Some 54% (425, n=783) of responders reported that their hospital pharmacy was involved in the procurement, supply or supervision of medical devices. These numbers are very similar to those from the baseline and 2015 surveys.
Section B: questions related to sections 2, 5 and 6 of the EAHP Statements
Online supplementary table 2 shows all the questions asked in the survey regarding sections 2, 5 and 6 of the Statements and, where applicable, the overall percentage of participants who gave a positive response to the question. When a participant gave a negative response to a question, there was usually a follow-up question asking ‘What is preventing this?’. Questions where <50% of participants gave a positive response and questions where >75% of participants gave a positive response are highlighted. The question numbering indicates the relationship between the questions and respective Statements (eg, S21 is related to Statement 1 in section 2, etc).
Supplemental material
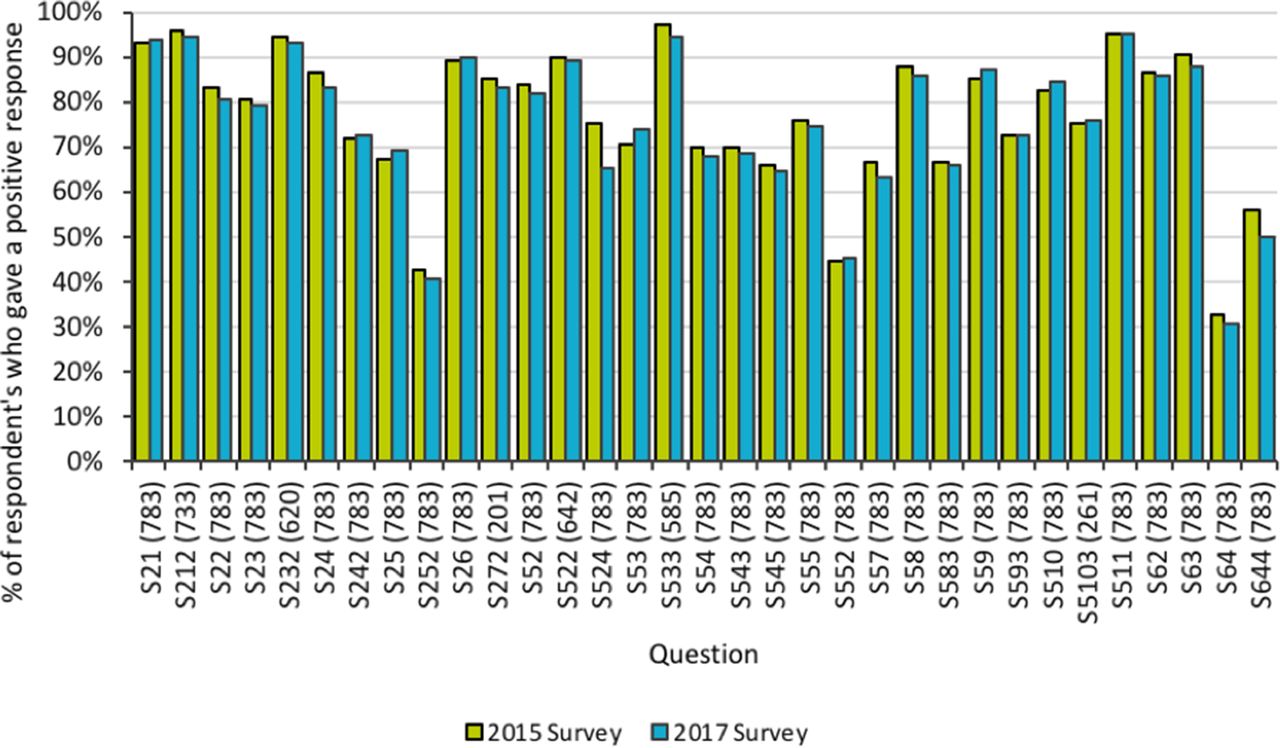
Figure 1 shows the results of the 2017 EAHP Statements Survey alongside the results of the 2015 survey. The numbers in brackets on the bottom axis are the number of responses by country for the 2017 survey. It can be seen that generally for each question the mean number of positive responses from countries remains similar but that in most cases the percentage has decreased slightly. Of the 33 questions surveyed, 20 showed a decrease in positive responses, nine showed an increase, and four remained the same. This indicates that the barriers to implementing the statements that countries were reporting in 2015 are still in place.

Comparative data: overall percentage of positive responses from the 2017 EAHP Statements Survey and the 2015 survey.
The five questions which received the least positive responses were identified (online supplementary table 2) and were subjected to a more in-depth analysis. These five questions were related to four Statements: 6.4, 5.5, 2.5 and 5.7 (table 1).
Five questions with the lowest mean percentage of positive responses across the different countries
Questions related to S6.4
The question with the lowest overall percentage of positive responses was S6.4, related to Statement 6.4, which reads ’Hospital pharmacists should actively engage in and publish research, particularly on hospital pharmacy practice. Research methods should be part of undergraduate and postgraduate training programmes for hospital pharmacists'.
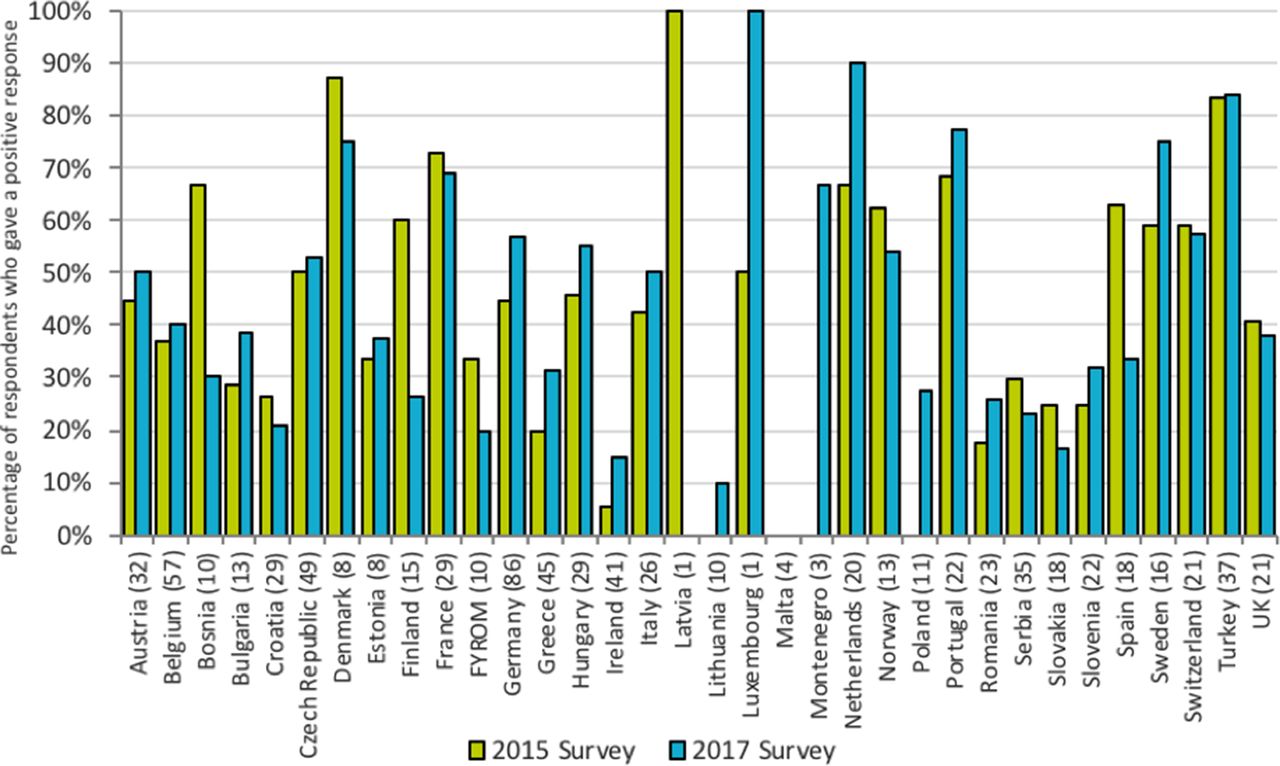
Figure 2 shows the percentage of respondents who gave a positive response when asked if pharmacists routinely publish hospital pharmacy practice research. Overall, only 30% of responses were positive to this question. In every country surveyed, less than half of the respondents gave a positive response, except for FYROM, Italy, Spain, the Netherlands and Latvia (which only had a single response). Examination of the responses from individual countries who participated in both surveys reveals better results, as the percentage of positive responses increased in 16 countries, decreased in 14 countries and stayed the same in two countries. A paired samples t-test indicated that the mean percentage of positive responses for countries significantly decreased between the baseline survey (mean 0.433, SD 0.198) and the 2017 survey (mean 0.316, SD 0.135) (t(27)=4.154, p<0.01, d=0.785). Following on from the initial question, respondents were also asked ’How many external presentations/papers/posters were submitted last year by your pharmacy?' (S6.4.1) and ’How often are internal presentations given by your pharmacy?' (S6.4.2). The most frequent responses to question S6.4.1 were ’none' (354 responses across all countries) and '1 to 2' (233 responses across all countries). These two categories of response account for 75% of total responses to the question. The proportion of responses indicating three or more publications is generally low, although there is variance across different countries, for instance results from Italy showed 20 out of 26 respondents answered three or more publications. The most common response for S6.4.2 (’How often are internal presentations given by your pharmacy?') was ’less often than monthly' (400 responses across all countries). This was significantly higher than the next most popular response of ’monthly' (185 responses across all countries). A total of 153 responses indicated that their pharmacy never gives internal presentations, with just 18 responses stating that they do this weekly. Countries which indicated that they are involved in internal presentations more frequently (eg, the Netherlands or Spain) also revealed that they experience fewer barriers to publishing research.

Percentage of respondents who gave a positive response to the statement ‘The pharmacists in our hospital routinely publish hospital pharmacy practice research’.
To further understand this, respondents were asked what the barriers to publishing more were, the overall results of which are shown in online supplementary figure 1. The most frequent overall answer was lack of capacity, with 570 responses suggesting many pharmacists do not have time to perform this activity. Another major barrier identified was lack of capability, with 247 responses. Not being considered to be a priority by managers was also raised as a barrier, with 186 responses. The most common free-text responses in the ’Other' category were lack of time/capacity (nine responses) and lack of experience/no previous research culture (five responses).
Supplemental material
The barriers identified in the 2017 survey, and the proportion of responses they account for, are very similar to the results from the 2015 survey. For example, lack of capacity represented 48% of the responses in the 2017 survey compared with 51% of the total responses in the 2015 survey. Lack of capability represented 21% of the responses in 2017 compared with 19% of the total responses in the 2015 survey, while not being considered a priority by managers represented 16% of the responses in both the 2015 and 2017 surveys.
As lack of capacity was cited as the biggest barrier to publishing by such a large amount, the relationship between pharmacist workforce and publishing ability was investigated further. The responses to the question whether pharmacists routinely publish hospital pharmacy practice research are shown in figure 3, where the results are grouped by the number of fully qualified pharmacists employed by the hospital. The proportion of more negative responses (1 or 2) is much higher for the lowest staffing level (1–10 pharmacists), although note that the total numbers of responses for the higher staffing levels are fairly small.

Overall results of responses to the statement ‘The pharmacists in our hospital routinely publish hospital pharmacy practice research’ (grouped by number of fully qualified pharmacists employed by the hospital).
Testing showed that the assumption was true that teaching or university hospitals produce more research as they may have more academic links or training available for writing papers and explaining the publishing process. A Mann-Whitney test indicated that teaching/university hospitals reported more positive responses than non-teaching hospitals when asked if pharmacists in the hospital routinely publish their work (U=49 748, p<0.01, r=0.302), with a mean rank of 467.7 for teaching/university hospitals and 336.3 for non-teaching hospitals. Note that as the responses are ranked from lowest to highest in this test, the teaching/university hospitals group (which has a higher mean rank) will have more positive responses in it than the non-teaching hospitals group (which has a lower mean rank).
The percentage of respondents who gave a positive response to survey question 6.4.4 (‘Have you or your pharmacists engaged in development of local/national guidelines?’) can be seen in figure 4. The overall positive response rate for this question was 50%, down from 58% in the 2015 survey. This particular question was not included in the original baseline survey. Responses to this question varied greatly between countries. Of the countries who participated in both the 2015 and 2017 surveys, 20 saw a decrease in the percentage of positive responses, while 10 saw an increase, and two remained the same.

Percentage of respondents who gave a positive response to the statement ‘Have you or your pharmacists engaged in development of local/national guidelines?’.
A paired samples t-test indicated that the mean percentage of positive responses for countries was not significantly different for the 2015 survey (M=0.560, SD=0.216) compared with the 2017 survey (M=0.548, SD=0.210) (t(27)=0.419, p=0.679, d=0.0792).
With more than twice as many responses as the next option, the main barrier to implementing this statement was identified to be limited capacity (236 responses), followed by limited capability (117 responses) and not considered a priority by my manager (108 responses). It is notable that Statement 6.4 was also considered to be the most challenging when this question was asked in section C of the survey.
Question related to EAHP Statement 5.5
EAHP Statement 5.5 reads ’Hospital pharmacists should help to decrease the risk of medication errors by disseminating evidence-based approaches to error reduction including computerised decision support’, while Survey question 5.5.2 reads ‘Our hospital pharmacy uses computerised decision support to reduce the risk of medication errors’.
The responses to Survey question 5.5.2 are shown in figure 5. The mean response for countries was 45% positive, showing this statement is not currently implemented widely across European hospitals. This response is slightly higher than the result from the 2015 survey, which was 44% positive, indicating that progress on this issue may be stagnant. For the countries who responded to both surveys, 18 countries saw an increase in the number of positive responses, and 14 countries saw a decrease in the number of positive responses in the 2017 survey compared with the 2015 survey. The positive response rate between countries was variable, as in 19 countries less than 50% of respondents gave a positive response while six countries gave an average positive response of 75% or greater.

Percentage of respondents who gave a positive response to the statement ‘Our hospital pharmacy uses computerised decision support to reduce the risk of medication errors’.
When the question about what was preventing the use of computerised decision support to reduce the risk of medication errors was asked, the most frequent responses were lack of capacity (223 responses), not considered to be a priority by my managers (168 responses) and lack of capability (126 responses). Several comments in the ‘Other’ category from different countries stated that they were in the process of setting up or developing a system, while other respondents indicated that IT infrastructure and lack of finance were problematic. A number of responses also indicated that documentation was paper based.
Question related to EAHP Statement 2.5
EAHP Statement 2.5 reads ’Each hospital pharmacy should have contingency plans for shortages of medicines that it procures'. This Statement is clearly linked to medicines shortages, which are a persistent problem in current healthcare systems.6 Survey question 2.5.2 reads ‘Have you had reason to contact the medicines authority in your country because of medicines shortages?’.
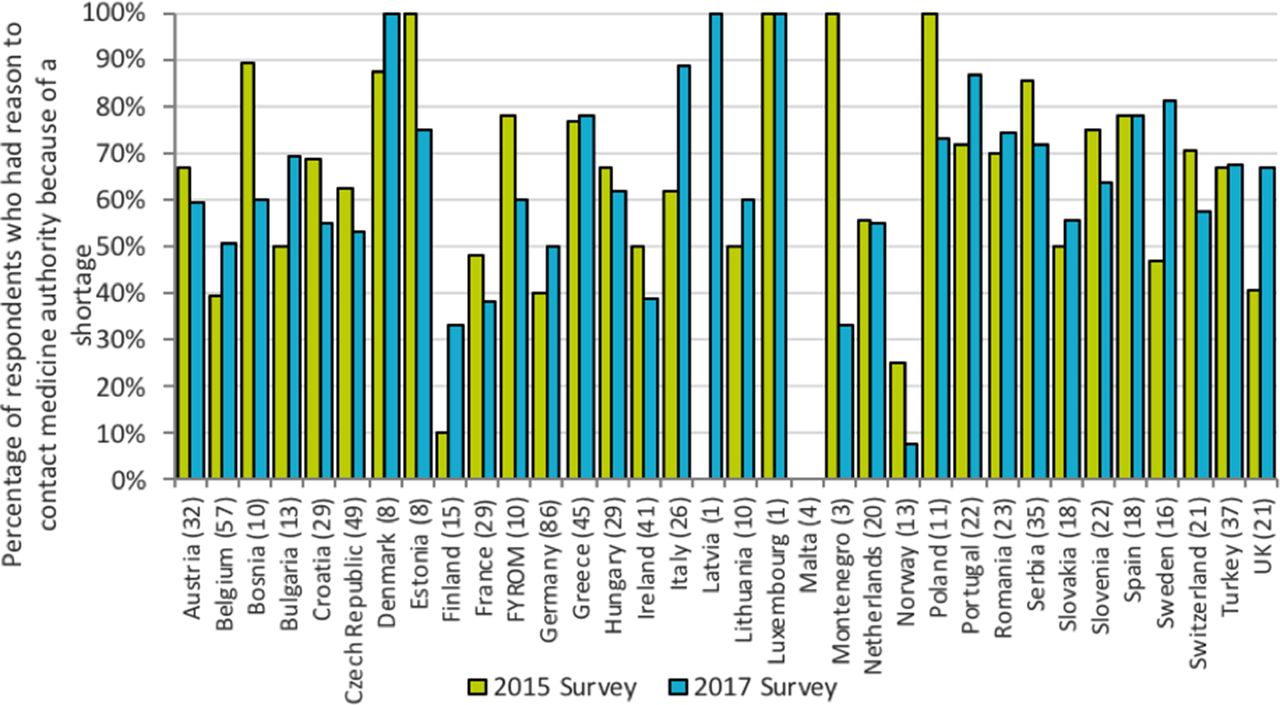
Figure 6 shows the percentage of respondents who indicated that they did have reason to contact the medicines authority because of a shortage. The overall percentage of ‘Yes’ responses was 60%, slightly higher than the 58% observed in the 2015 survey. A paired samples t-test indicated that the mean percentage of ‘Yes’ responses for countries was not significantly different for the 2015 survey (mean 0.617, SD 0.202) compared with the 2017 survey (mean 0.620, SD 0.188) (t(27)=−0.079, p=0.938, d=−0.0149). Respondents who replied that they had had reason to contact the medicine authority due to a shortage were asked ‘What was your reason to contact the medicines authority?’ The results were split fairly evenly between ‘To inform them of a drug shortage' (323 responses), ‘To ask them for details about the reasons’ (302 responses) and ‘To enquire on a likely timeframe for the shortage' (292 responses). There were 160 respondents who selected all three options. Of the 58 responses in the ’Other' category, the most common reasons were ‘To get permission or guidance on importing drugs’ and ‘To enquire about what alternative drugs can be used instead’. The reasons for contacting the medicines authority are largely consistent between countries.

Percentage of respondents who gave a positive response to the statement ‘Have you had reason to contact the medicines authority in your country because of medicines shortages?’.
When participants were also asked if the pharmacies in their hospital had contingency plans for medication shortages, 69% responded positively. The biggest barrier to having contingency plans for medicines was identified as limited capacity (100 responses), but there were also a sizeable number of responses stating it was not considered a priority by managers (65 responses) and it was prevented by national policy or legislation (62 responses). The majority of the ‘Other’ responses can be summarised as saying that shortages are handled on a case-by-case basis without a formal plan in place (22 of 42 responses).
Question related to the EAHP Statement 5.7
EAHP Statement 5.7 reads ‘Hospital pharmacists should ensure that the medicines administration process is designed such that transcription steps between the original prescription and the medicines administration record are eliminated’. There was an overall positive response rate of 63% to the Survey statement ’The medicines administration process in our hospital ensures that transcription steps between the original prescription and the medicines administration record are eliminated’. This is a less positive response compared with the answers to the same question asked 2 years ago in the 2015 survey (67% positive). Figure 7 shows the results broken down by country, which reveals that the response between countries is mixed, with a large range between results.

Percentage of respondents who gave a positive response to the statement ‘The medicines administration process in our hospital ensures that transcription steps between the original prescription and the medicines administration record are eliminated’.
As this question was also asked in the baseline survey, comparisons can be made with those data as well. A paired samples t-test indicated that the mean percentage of positive responses for countries was not significantly different for the baseline survey (mean 0.679, SD 0.157) compared with the 2017 survey (mean 0.665, SD 0.220) (t(27)=0.383, p=0.705, d=0.0724).
Participants who gave a negative response to Statement 5.7 were then asked what was preventing this. Online supplementary figure 2 shows that the most common response was limited capacity (with 150 responses), followed by not considered to be a priority by my managers (108 responses) and limited capability (75 responses). There were also a large number of ‘Other’ responses (53 responses), with 24 responses describing how electronic systems are not used, or paper records are still mainly used. Ten responses indicated work on implementing an electronic system was in progress.
Supplemental material
The overall results for this statement question were also grouped by the number of fully qualified pharmacists working at the hospital. Unlike the ’Other' statement questions examined this way, the difference between the groups’ responses was much smaller, with a range of 62.0%–70.0% between groups. Although lack of capacity was still given as the main barrier to implementing this statement, this could be more to do with lack of funding for the necessary electronic systems to implement the statement rather than the capacity of the workforce.
Section C: results of the implementation questions
The questions in this section explore further the barriers to implementation of the Statements in general. They seek to explore the common reasons such as lack of awareness, agreement, workforce barriers and those related to confidence in ability to implement the Statements. Responders were asked to state the level of their agreement with each question posed, from 1 (strongly disagree) to 5 (strongly agree). The results from this section show a statistically significant increase in awareness of the European Statements among hospital pharmacists, increasing from the baseline survey (mean 0.398, SD 0.251) to the 2017 survey (mean 0.485, SD 0.244) (t(27)=−2.859, p=0.008, d=−0.540). No statistically significant change was seen in overall capacity, capability or commitment to implement the Statements.
Discussion
There are several limitations to this study. The first and most important limitation was that the number of responses from some member countries was very small, and hence did not allow a precise statistical evaluation at country level. The reason for this is that some countries have a much smaller population and therefore far fewer hospitals (and, therefore, fewer hospital pharmacists). The second limitation was the necessity to find a balance between the length of the questionnaire (and the workload for responders) and the level of detail sought in identifying the main implementation barriers.
Despite these limitations, the survey results provide an up-to-date picture of the current state of our profession in Europe in relation to the Statements. There appear to be more barriers to hospital pharmacies engaging in more clinically focused activities such as publishing practice research and use of systems to reduce medication error. Lack of capacity (not having enough staff), lack of capability (not having staff with the required skills), and lack of support from managers are the commonly cited reasons for this. Again, there was considerable variation across the different countries, reflecting the role of pharmacists in those countries. The role of the clinical pharmacist where the pharmacist is visible on the ward and in clinics, while well established in some countries, is still a rarity in others. Pharmacist prescribing is recognised in some countries like the UK but not legally permissible in the majority. In addition, it would appear that many hospitals employ low numbers of pharmacists and technicians in relation to their number of beds, which would support the ‘lack of capacity’ responses. In addition, the capacity of hospital pharmacists is often impacted by inevitable external causes, such as medicine shortages.
Examination of the five statements where the barriers to implementation were greatest revealed that most of the responses did not show a statistically significant difference compared with the results from previous surveys (with the exception of S6.4 which showed a statistically significant decrease). An explanation for this could be that implementing the Statements is a gradual process, so any changes on a large scale may be happening slowly and are not yet reflected in the survey results. Note that this result measures average change across all countries, and that individual countries may have seen greater changes in the implementation of the Statements.
The positive change in the level of awareness suggests that the role of the EAHP Statement Ambassadors should continue to be developed. Removing the main barriers such as insufficient staffing will take a long time, and increasing awareness is a necessary first step in this journey.
The next survey, in autumn 2018, will focus on sections 1, 3 and 4.
Conclusion
The main objective of the 2017 EAHP Statements Survey was to provide an assessment of the level of implementation of sections 2, 5 and 6 of the Statements throughout European countries and to identify the main barriers to and drivers of implementation and investigate possible progress in implementation. This enables the EAHP to prioritise efforts in its implementation activities. This objective has been reached, thanks to the enormous efforts of national coordinators and all of our members who responded to the survey. The data will now be used to inform the EAHP Statements implementation project as well as other major EAHP projects.
Footnotes
EAHP Statement 2: Selection, Procurement and Distribution. EAHP Statement 5: Patient Safety and Quality Assurance. EAHP Statement 6: Education and Research.
Contributors PH, JU and AB planned the study and designed the questionnaire. NG set up the online form, sent the questionnaire to responders and tracked responses. PH, AB and SA communicated with EAHP members and raised awareness about the survey. NG, JU and PH conducted the survey, evaluated data and performed statistical analysis. PH, JU, NG, AB and SA prepared the manuscript.
Funding The authors have not declared a specific grant for this research from any funding agency in the public, commercial or not-for-profit sectors.
Competing interests None declared.
Patient consent Not required.
Provenance and peer review Not commissioned; internally peer reviewed.
Data sharing statement The complete set of data form the survey is available to EAHP member associations.